
- Cross Validation
- Validation Set Approach
- Leave-one-out-cross-validation
- k-Fold Cross Validation
- Bias-Variance Trade-Off for k-Fold Cross-Validation
- Cross Validation on Classification Problems
- Bootstrap
- References
Cross Validation
The test error is the average error that results from using a statistical learning method to predict the response on a new observation. For a dataset, a statistical learning method is suitable if it gives a low test error. If a test dataset is available then the test error can be calculated but its not generally the case. Training error is calculated by applying statistical learning methods to the observations used in the training. This is quite different than the test error rate and can underestimate the test error also.
If a test dataset is unavailable then the test error rate can be found out by several ways. First some mathematical adjustments can be made to the training error rate to estimate the test error. And a subset of the training data can be kept away from model fitting and be then applied to the learning methods to get a test error.
Validation Set Approach
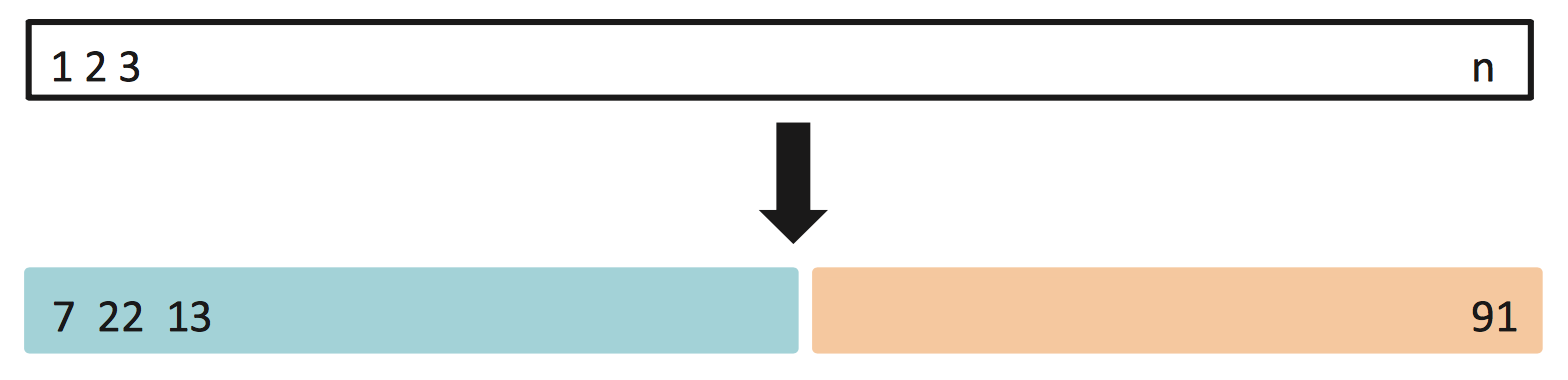
This method is used to estimate the test error associated with fitting a particular statistical learning method on a set of observations. It involves randomly dividing the available observations into two sets – a training set and a validation set. The training set is used to fit the model on while the fitted model is used to predict the responses for the observations in the validation set. The validation set error rate gives an estimate of the test error rate.
The division should be made so that both the subsets are of comparable sizes but it can happen in any random manner. But if the observations are divided again and again and the same learning method is used to produce the test error, then there would be some variation in the error rates produced each time.
Though conceptually simple and easy to implement, the validation set approach has some potential drawbacks:
The validation estimate of the test error rate can be highly variable depending on which observations are included in the training set and which observations are included in the validation set.
Some statistical methods don’t perform well with fewer observations. So when using the validation set approach on a subset of the observations, the error rate may tend to overestimate the test error rate for the model fit on the entire data set.
Leave-one-out-cross-validation
Leave-one-out-cross-validation (LOOCV) is related to the validation set approach but it attempts to address the drawbacks of the method.
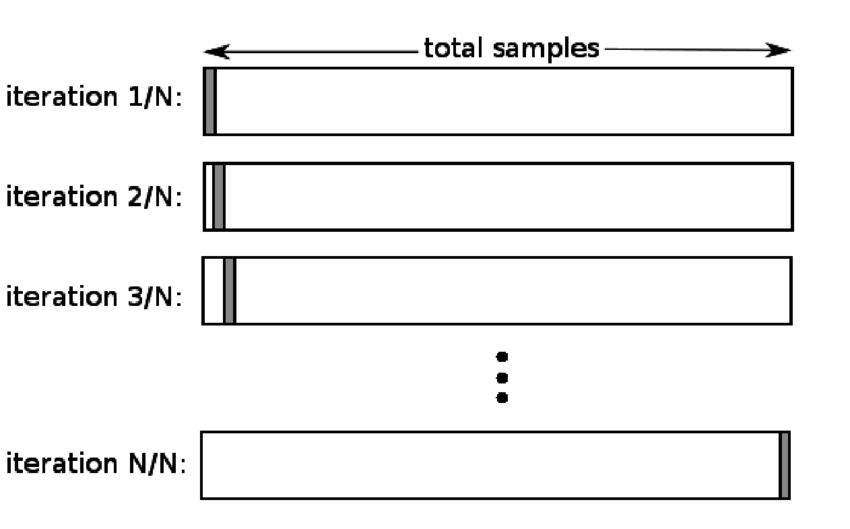
Like the validation set approach, LOOCV involves splitting the set of observations into two parts. But instead of creating two subsets of comparable sizes, a single observation $(x_1,y_1)$ is used for the validation set and the remaining observations $(x_2,y_2),…,(x_n,y_n)$ make up the training set. The statistical learning method is fit on the n-1 training observations and a predictory $\hat{y_1}$ is made for the excluded observation. As $(x_1, y_1)$ was not used to fit the method, ${MSE_1}=(y_1-\hat{y_1})^2$ provides an approximately unbiased estimate for the test error. But as $MSE_1$ is based upon a single observation which is highly variable hence it is a poor estimate.
So this method can be repeated n times for the other observations one by one to produce n squared errors, $MSE_1$, $MSE_2$,…, $MSE_n$. The LOOCV estimate for the test MSE is then the average of these n test error estimates.
$CV_n = \frac{1}{n}\sum_{i=1}^n{MSE_i}$
LOOCV has some major advantages over validation set approach.
Less Bias: As the statistical methods are fitted with training sets containing n-1 observations, almost the same number of observations in the entire data set, the approach doesn’t tend to overestimate the test error rate as much as the validation set approach does.
Same results: Performing LOOCV multiple times always yields the same results as there is no randomness in the training/validation set splits.
LOOCV is a very general method and can be used with any kind of predictive modeling. For ex: it can be used with simple linear regression or logarithmic regression or even LDA.
k-Fold Cross Validation
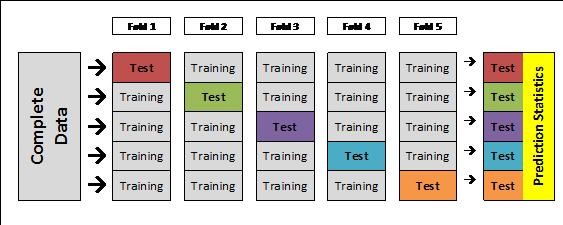
This approach of cross validation involves randomly dividing the set of observations into k-groups or k-folds of approximately equal size. The first fold is treated as a validation set and the statistical learning method is fit on the remaining k-1 folds. The mean squared error, $MSE_1$ is then computed on the observations in the held out folds. This procedure is then repeated k times. Each time a different group of observations is treated as a validation set. This process results in k estimates of the test error $MSE_1$, $MSE_2$,…, $MSE_k$. The k-fold cross validation estimate is then calculated by averaging all the values.
$CV_k = \frac{1}{k}\sum_{i=1}^k{MSE_i}$
LOOCV is a special case of k-fold CV where k is equal to n. In practice, k is kept 5 or 10. Advantage of keeping the k-value small is the less amount of computation it would require. LOOCV requires fitting the statistical method n times which is computationally expensive if n is very large.
While performing cross-validation, the main aim is to determine how a statistically learning procedure can be expected to perform on independent data so the test MSE estimate gets a lot of importance. But most of the times cross-validation is performed on a number of statistical learning methods or on a single method using different levels of flexibility, so the minimum point in the estimated test MSE curve is required not the actual test MSE.
Bias-Variance Trade-Off for k-Fold Cross-Validation
In addition to the computational advantages of k-Fold Cross-Validation over LOOCV, the former method gives more accurate estimates of the test error rate than LOOCV. This is because of the bias-variance trade-off.
Validation set approach overestimates the test error rate as the training set used to fit the statistical learning method contains only half the observations in the entire data set. Similarly LOOCV gives approximately unbiased estimates of the test error as each training set contains n-1 observations which is almost equal to the total number of observations in the entire data set. k-Fold CV should similarly give an intermediate level of bias as the number of observations is more than LOOCV but less than validation set approach. But apart from bias, the variance should also be taken into consideration.
LOOCV has higher variance than k-fold CV as the outputs got from the n fitted models trained on almost identical observations are highly correlated with each other. In the case of k-Fold CV with k < n, the outputs of the k fitted models are less correlated with each other as the overlap between the training sets in each model is smaller. The mean of many highly correlated quantities has higher variance than the mean of many quantities that are not as highly correlated, the test error estimate from LOOCV tends to have higher variance than does the test error estimate resulting from k-Fold CV.
There is bias-variance trade-off associated with the choice of k in k-Fold CV. Using k=5 or k=10 has shown to produce test error rate estimates that suffer neither from excessively high bias nor from high variance.
Cross Validation on Classification Problems
The use of cross-validation shown above is in the regression setting where the outcome is quantitative so MSE was used to quantify test error. But cross-validation can be used for a qualitative setting also where instead of using MSE to quantify the test error, the number of misclassified observations is to be used for quantifying the test error. The LOOCV error rate takes the following form:
$CV_n = \frac{1}{n}\sum_{i=1}^n{Err_i}$
where $Err_i=I(y\ne\hat{y_i})$.
Bootstrap
The bootstrap is a widely applicable and powerful statistical tool used to quantify the uncertainty associated with a given estimator or statistical learning method. For example, it can find out the standard errors of the coefficients from a linear regression fit. This can be done by using some standard statistical software also but bootstrap can be applied to a wide range of statistical learning methods including those whose variability measurement is difficult and is not automatically given as output by the statistical softwares.
The standard deviation of any estimate cannot be found easily for real data as a lot of samples need to be created from the original data. The bootstrap approach allows computer to obtain new sample sets without generating additional samples. This is done by repeatedly sampling observations from the original data set with replacement.
The advantage of bootstrap is its simplicity. It is quite a straightforward way to derive estimates of standard errors and confidence intervals for complex estimators of complex parameters of the distribution such as percentile points, proportions, ratio, etc. Knowing the true confidence interval for most problems is very hard but bootstrap gives more accurate results than by using sample variance or assumptions of normality.
Bootstrap can be used in the following situations:
When the distribution of a statistic in interest is complicated or unknown
When the sample size is insufficient for any direct statistical inference
When power calculations are needed to be performed and a small sample is available
References
James G., Witten D., Hastie T., Tibshirani R. (2013). An introduction to Statistical Learning. New York, NY: Springer
Bootstrapping (statistics). (2017). En.wikipedia.org. Retrieved 31 August 2017, from https://en.wikipedia.org/wiki/Bootstrapping_(statistics)
This article is written by ashmin Follow him @ashminswain.
Share this:


